Bitcoin Price Levels to Watch in Post-Election Rally
Bitcoin's price journey is like a wild rollercoaster ride, and if you haven't been gripping your seat lately, the post-election surge might just make you reconsider. With curiosity piqued, let's plunge into the whirlwind of numbers and patterns that shape Bitcoin's destiny as it inches ever closer to that tantalizing $90,000 mark.
To kick off this ride, let's talk about the electrifying post-election atmosphere that's fueled Bitcoin's meteoric rise. Since Donald Trump waltzed into the political spotlight as the U.S. presidential victor, Bitcoin has been on a runaway train, shattering previous ceilings. In a mere week, the cryptocurrency has catapulted about 25%, sending it into the stratosphere of record highs. Why, you ask? Well, market optimism is riding high, thanks to expectations that Trump's administration, along with Republican bigwigs, might just bring some clarity to the chaotic world of digital asset regulation. Couple that with musings about a strategic Bitcoin reserve, and you've got a recipe for bullish fervor.
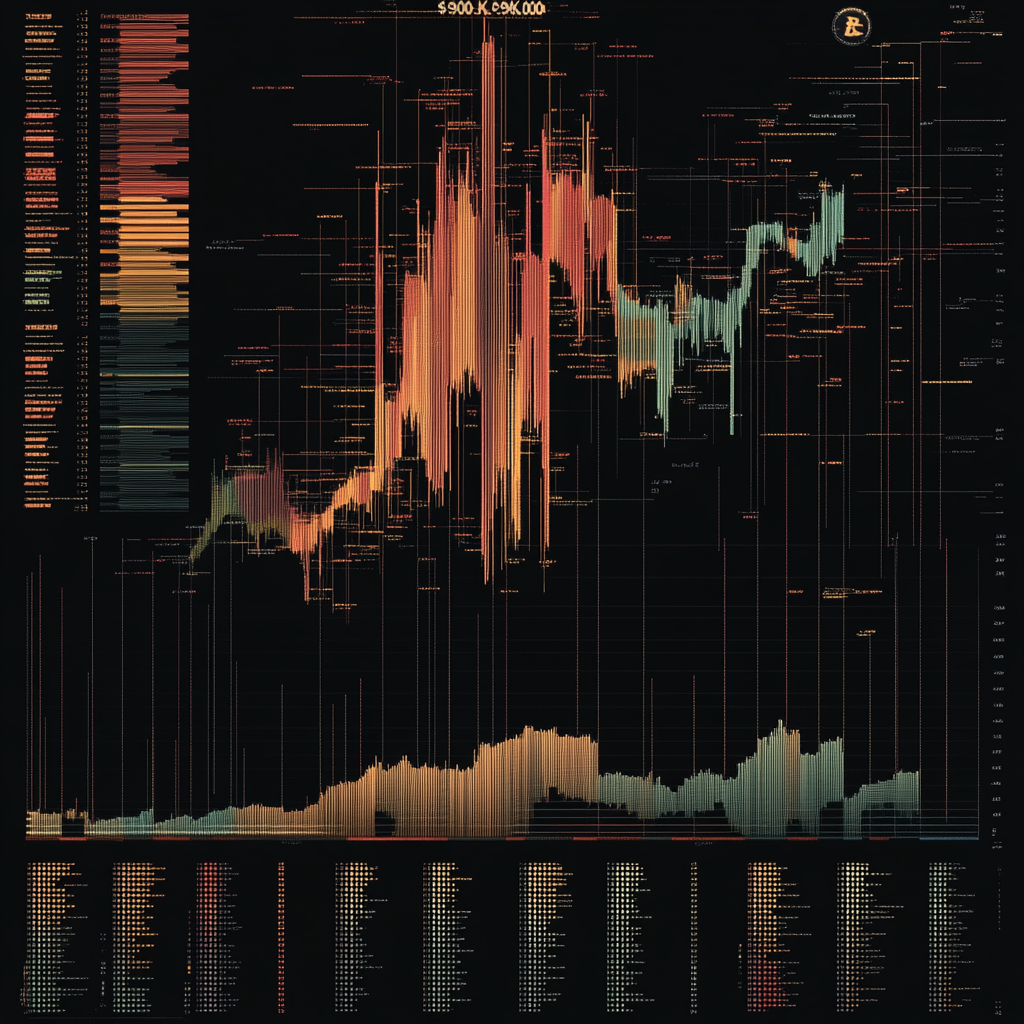
Now, as we tip-toe around that ever-so-crucial $90,000 mark, there are price levels that every investor worth their salt needs to keep a keen eye on. First up, the infamous $90,000 resistance. Much like that stop sign at the end of a leisurely drive, Bitcoin has hit a temporary wall here. CoinDesk flagged this resistance level last week, and it’s not a surprise after such an outrageous leap of $20,000 in just seven days. Traders are primed for a breakout, with eyes on the prize of $110,000 to $120,000. You can almost feel the collective excitement in the air as bullish sentiments ramp up.
But, as we all know, every top has its bottom. Enter the critical support zones that savvy investors must monitor. Keep your eyes peeled on the range between $73,000 and $70,000 – that’s where buying interest may converge. Picture this: those levels flipping from being previous barriers to shields for future crashes. Exciting times, indeed!
Yet, technical analysis is prowling like a clever fox, and the double-top formation signals that things might be getting shaky around $90,000. If Bitcoin takes a dive below the $85,000 mark, it could be the start of a worrying pullback, with critical support lurking at $77,000 and $73,000. It's like navigating a maze; one wrong turn could lead us into the stock market abyss.
Oh, but it doesn’t end there! Flip over to technical indicators, where the 50-day moving average (MA) is doing a little dance with the 200-day MA, forming a golden cross. This is generally good news—a herald of an impending uptrend. Yet, on the flip side, the relative strength index (RSI) is waving its red flag, signaling that Bitcoin is quite overbought. What this boils down to is that while the momentum is strong, we may witness some short-term profit-taking as prudent investors cash in on those sizzling gains.
Let’s sprinkle in the bars pattern technique while we’re at it. This method takes a stroll down memory lane, assessing prior trends to predict future movements, and boy, it’s predicting a whopping $150,000 upside target for Bitcoin. However, let’s not get too carried away; this projection banks on the continuation of the current trend until early March next year, echoing past patterns.
Now, let's not forget the emotional rollercoaster of market sentiment. Despite jaw-dropping gains, profit-taking is chilling at levels below historical highs. A report from Glassnode reveals that realized profit volumes have been hanging around an average of $1.56 billion per day since Bitcoin sprinted past its March all-time high. That’s half of the $3 billion per day that reigned during the euphoric peaks of previous cycles! It seems like investors might be feeling a tad cautious; after all, they could be waiting for the right moment to strike.
In the backdrop of all this excitement lurks the U.S. dollar's strength, which is indeed worth considering. The dollar index (DXY) has climbed a notable 2.7%, settling at a six-month high. This market movement could spark the return of the historical negative correlation between the dollar and Bitcoin, potentially throwing a spanner in the works of Bitcoin's march towards higher values. Not to mention the creeping bond yields, particularly the two-year U.S. Treasury note, which has ballooned to 4.36%, offering support to the dollar amidst rising fears.
So, what does this all mean? Well, Bitcoin’s journey toward $100,000 is juxtaposed with a mix of optimism and caution. While the long-term sentiment remains relentlessly bullish—propelled by fervent forecasts for Bitcoin to touch $200,000 by 2025—short-term corrections are definitely on the radar. Overbought conditions, alongside increased selling pressure from miners, could stir some turbulence in this crypto paradise.
As you navigate these exhilarating avenues of the cryptocurrency landscape, keep those keen eyes peeled on these critical price levels and technical indicators. Whether you're a grizzled veteran or a bright-eyed newbie to this wild world, knowing these dynamics can illuminate your path, helping you sidestep pitfalls while catching the next big wave.
So, buckle up! The Bitcoin express is zooming towards exciting destinations, and you’re invited on this adrenaline-charged ride. Want to stay up to date with the latest news on neural networks and automation? Subscribe to our Telegram channel: @channel_neirotoken.
In this fast-paced universe of cryptocurrency, knowledge is not just power; it’s the ticket to a thrilling journey. Keep your mind as sharp as a tack, and you might just find yourself navigating the twists and turns like a pro!